Hardware-in-the-loop testing for lab instruments and the firmware inside your DUT.面向实验室仪器的硬件在环测试,也覆盖 DUT 里的固件。
One safety-checked harness builds, flashes, steps and measures instruments and DUTs.一个经过安全检查的框架,负责构建、烧录、单步执行,并测量仪器与 DUT。
One line installs it, in any coding agent一行即可安装,适用于任何编码智能体
Install the HIL hardware-in-the-loop harness with its MCP server from https://github.com/adwuard/HIL, register it with this coding agent, and run hil doctor to confirm the bench is ready.prefer shell? 更喜欢命令行?pip install 'git+https://github.com/adwuard/HIL.git#egg=hil-harness[mcp]' && hil mcp install
Every instrument speaks SCPI. Every vendor speaks it differently.每台仪器都说 SCPI,每家厂商的方言各不相同。
HIL is the layer that makes a bench behave like one coherent, safety-checked machine instead of a drawer of dialects.HIL 是那一层:让整张工作台表现得像一台统一、经过安全检查的机器,而不是一抽屉方言。
Each device profile carries a policy. The bench refuses to send a command the profile blocks, and enforces limits on the ones it allows, before anything reaches the hardware.每个设备档案都携带一份策略。工作台拒绝发送被档案阻止的命令,并对放行的命令强制设限,而这一切都发生在触达硬件之前。
Every procedure is plain YAML you can dry-run with --sim and validate statically with no instrument attached, so a bad plan fails on your laptop, not on your DUT.每个流程都是纯 YAML,可以用 --sim 干跑,也能在不连接任何仪器的情况下静态校验,让糟糕的计划失败在你的笔记本上,而不是 DUT 上。
TCP, serial, VISA/GPIB, PPK2, logic-analyzer and debug transports all resolve through a single addressing scheme and a single driver registry.TCP、串口、VISA/GPIB、PPK2、逻辑分析仪与调试传输,全部通过同一套寻址方案和同一个驱动注册表解析。
One harness. Your workbench, your style.一个框架。你的工作台,你的风格。
Switch between the starter benches below, or make your own: any device profile you add to the registry becomes a workbench. Hover or focus any part of the figure to read how HIL reaches it; the console on the left replays a real session line by line, and the copyable prompts switch with the bench.在下面的入门工作台之间切换,或者自建一个:任何加入注册表的设备档案都会成为一个工作台。悬停或聚焦图中任意部件,即可查看 HIL 如何触达它;左侧控制台逐行回放一次真实会话,可复制的提示词随工作台切换。
- you
Set the Keithley 2400 to 3.3 V with a 100 mA limit, then verify the rail on the scope.
- hil
hil_devices keithley-2400
- ok
profile loaded: SMU, driver scpi, safety policy pass
- hil
hil_exec SOUR:VOLT 3.3, CURR:LIM 0.1
- ok
ok, error queue empty
- hil
hil_exec MEAS:VOLT? on rigol-dho1072
- ok
3.298 V, within 10 mV: DUT clear to power
Hover a part to read it
Ask in plain words.用大白话下指令。
Two sentences per bench. Your agent resolves the devices, provisions the backends and calls the MCP tools itself; the tag names the tool it reaches for first.每张工作台两句话。你的智能体会自行解析设备、配置后端并调用 MCP 工具;标签注明它最先调用的工具。
- hil_exec
Set the Keithley 2400 to source 3.3 V with a 100 mA limit, then ask the Rigol scope whether the rail settles within 10 mV before the DUT powers up. Use hil_exec so the safety policy sees every command.
- hil_exec, hil_errors
Sweep the EA supply from 0 to 5 V in 100 mV steps, read back at each step, drain the error queue with hil_errors, and plot the linearity error from the returned JSON.
Build, flash, debug, dump, measure. Then loop.构建、烧录、调试、转储、测量。然后循环。
The same harness that drives the bench also drives the chip: one agent command compiles the firmware, writes it over the probe, halts and single-steps, spools RTT and memory dumps, and hands the running DUT to an instrument sequence. Hover any block in the figure to read its step.驱动工作台的同一个框架也驱动芯片:一条智能体命令即可编译固件、经探头写入、停机与单步、把 RTT 与内存转储写入 spool,再把运行中的 DUT 交给仪器序列。悬停图中任意方块即可查看对应步骤。
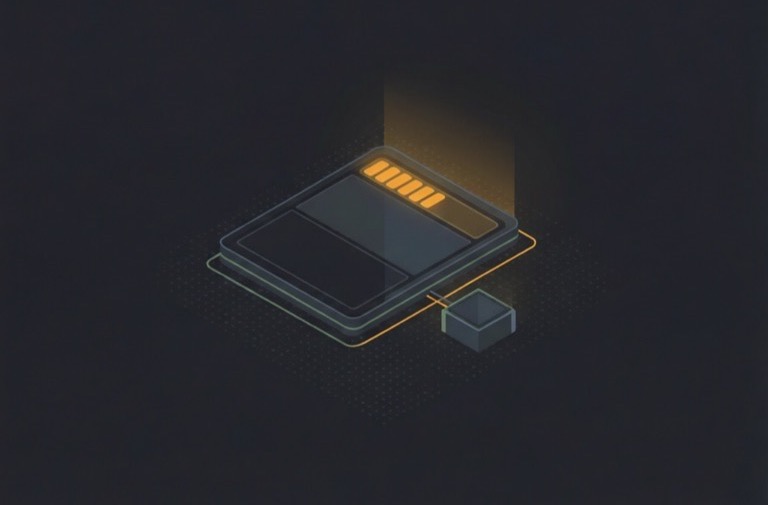
Build构建
The firmware compiles where it lives. HIL hashes the artifact, so every capture names the exact image on the chip.固件在它的源码所在地完成编译。HIL 会给产物计算哈希,因此每次捕获都能指名芯片上确切的镜像。
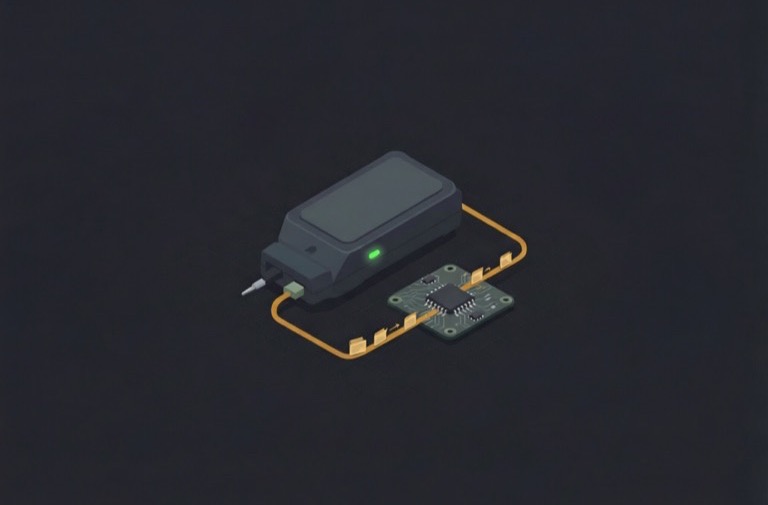
Flash烧录
probe-rs writes and verifies over SWD on Cortex-M, esptool over UART on ESP32. One command, any probe.probe-rs 在 Cortex-M 上经 SWD 写入并校验,esptool 在 ESP32 上经 UART 写入。一条命令,任意探头。
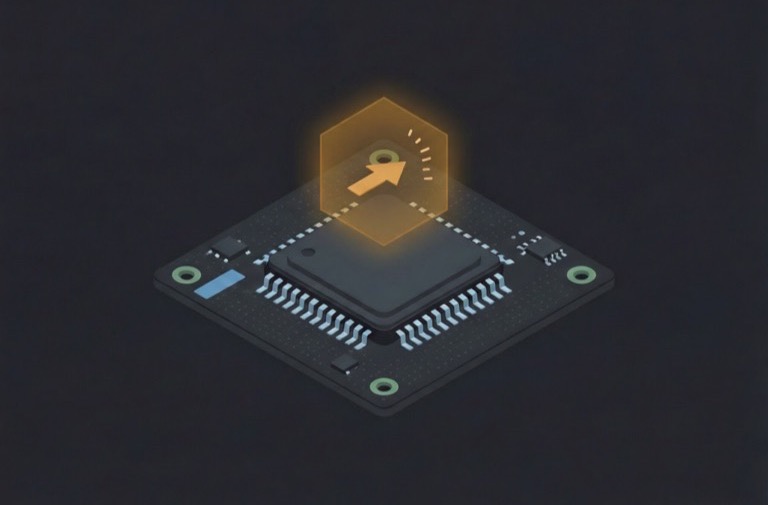
Debug调试
Halt at main, single-step init, watch the program counter and the fault registers. No debugger GUI required.在 main 处停机,单步执行 init,观察程序计数器与错误寄存器。无需调试器图形界面。
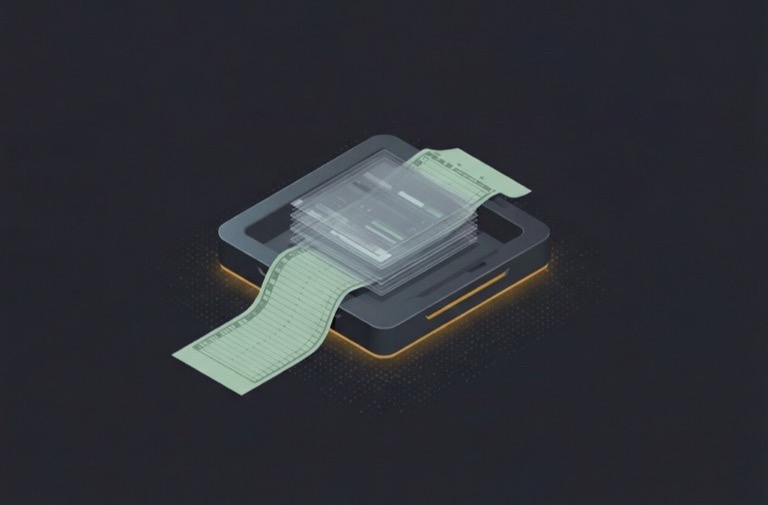
Dump转储
RTT console, registers and memory images land in the spool as artifacts, next to your captures.RTT 控制台、寄存器与内存镜像作为产物落入 spool,与你的捕获并排存放。
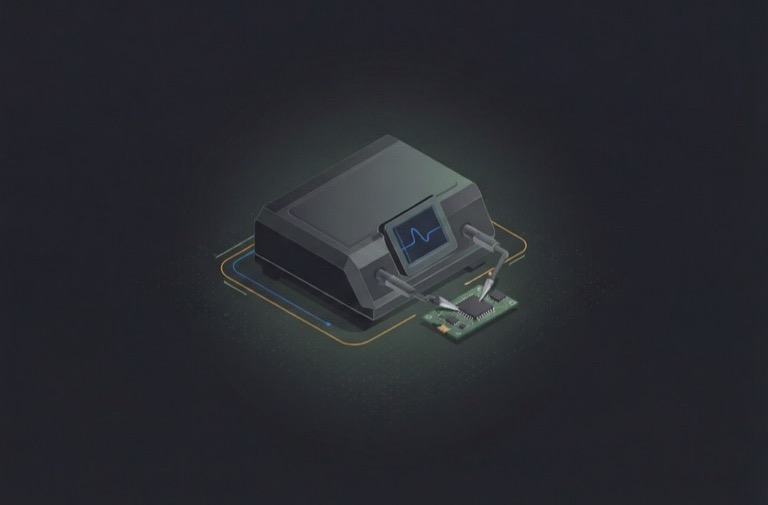
Measure测量
The bench procedure fires instruments and logic channels, gated on a DUT GPIO, then scores the run. A failed assertion sends the capture back to the build, and the loop runs again.台架流程触发仪器与逻辑通道,以 DUT 的 GPIO 为门控,然后为本次运行打分。断言失败会把捕获送回构建,循环再次运行。
DUTs, debuggers and probes.DUT、调试器与探头。
nRF52840 DK
SWD + RTT over the onboard J-Link经板载 J-Link 的 SWD + RTTFlashes, halts and streams log through the debug cable already on the board. The probe and its virtual serial port enumerate together, so a missing pair means a missing cable.通过板上已有的调试线完成烧录、停机与日志流式传输。探头与其虚拟串口会一同枚举,所以两者同时缺失意味着线缆没接。
ESP32-DevKit
UART ROM loader, JTAG stubUART ROM 加载器,JTAG stubesptool writes the image, then the stub opens flash breakpoints and single-stepping on the Xtensa cores.esptool 写入镜像,随后 stub 在 Xtensa 核上打开 flash 断点与单步。
generic Cortex-M通用 Cortex-M
SWD via probe-rs, pyOCD, OpenOCD or stlink经 probe-rs、pyOCD、OpenOCD 或 stlink 的 SWDAny CMSIS-DAP or ST-Link pod works. Memory dumps become CaptureArtifacts with hashes and tool metadata.任何 CMSIS-DAP 或 ST-Link 探头都能用。内存转储成为带哈希与工具元数据的 CaptureArtifact。
your target你的目标板
any backend the debug driver shells out to调试驱动可调用的任意后端The debug driver is backend-agnostic, so whatever probe-rs, pyOCD, OpenOCD, esptool or stlink reaches joins the loop: Cortex-M from M0 to M33, the ESP32 family, RISC-V where the backend allows. Add a registry profile and it appears here.调试驱动与后端无关,所以 probe-rs、pyOCD、OpenOCD、esptool 或 stlink 能触达的目标都会加入循环:从 M0 到 M33 的 Cortex-M、ESP32 家族,以及后端允许的 RISC-V。加一份注册表档案,它就会出现在这里。
Under the Hood深入内部
Eleven layers, one import.十一层,一次导入。
From the socket up to the command line, each layer has a single job and a stable --json contract.从套接字到命令行,每一层只做一件事,并提供稳定的 --json 契约。
Byte-pipes over TCP, serial and VISA/GPIB, with uniform connect/read/write semantics.基于 TCP、串口与 VISA/GPIB 的字节管道,具备统一的连接/读/写语义。
The device object: write, query, safe_execute and capture against whatever is addressed.设备对象:对寻址到的目标执行 write、query、safe_execute 与 capture。
Pluggable implementations (scpi, ppk2, logic, debug) plus third-party entry points.可插拔实现(scpi、ppk2、logic、debug),外加第三方入口点。
On-demand setup of optional backends via declarative recipes: detect, fetch/build, verify.通过声明式配方按需配置可选后端:检测、获取/构建、验证。
YAML device profiles: capabilities, command sets, connection examples and a safety policy.YAML 设备档案:能力、命令集、连接示例与安全策略。
One resolver for tcp://, serial://, visa://, ppk2://, logic://, debug:// or a registry slug.一个解析器,处理 tcp://、serial://、visa://、ppk2://、logic://、debug:// 或注册表 slug。
Channel sampling into summary stats and NDJSON, for soak tests and drift watches.把通道采样汇总成统计与 NDJSON,用于 soak 测试与漂移监控。
Captures and logs spooled as versioned artifacts (.atkdl, NDJSON, CSV) you can re-decode later.捕获与日志以版本化产物(.atkdl、NDJSON、CSV)写入 spool,之后可以重新解码。
The instrument SYST:ERR? queue drained and surfaced as structured facts, not silence.清空仪器的 SYST:ERR? 队列,并以结构化事实呈现,而不是沉默。
Procedures as data: YAML plans you can validate, simulate and run against real addresses.流程即数据:可校验、可模拟、可对真实地址运行的 YAML 计划。
An agent-first CLI where every command emits stable --json with meaningful exit codes.智能体优先的 CLI,每条命令都输出稳定的 --json 与有意义的退出码。
Built to be driven by an agent.为智能体驱动而生。
Structured output everywhere, a simulator for rehearsal, and an MCP server so your coding agent treats the bench as a set of tools with parseable results.处处结构化输出,一个用于演练的模拟器,以及一个 MCP 服务器,让你的编码智能体把工作台当作一组可解析结果的工具。
| Tool工具 | What it does作用 |
|---|---|
hil_doctor | Bench readiness: version, importable backends, device count, provisioning hints工作台就绪状态:版本、可导入的后端、设备数量、置备提示 |
hil_devices / hil_device | Search the registry / fetch one device's full profile (capabilities, commands, safety policy)搜索注册表 / 获取单台设备的完整档案(能力、命令、安全策略) |
hil_probe | Connectivity check: *IDN? + *OPC?, parsed identity连通性检查:*IDN? + *OPC?,解析身份信息 |
hil_exec | Run SCPI commands (a trailing ? queries); safety policy enforced; one structured result per command运行 SCPI 命令(末尾加 ? 即查询);强制安全策略;每条命令一个结构化结果 |
hil_errors | Drain the instrument's SYST:ERR? queue清空仪器的 SYST:ERR? 队列 |
hil_capture | Sample a channel for N seconds → summary stats (mean/min/max/p95/rate), optional NDJSON dump对某通道采样 N 秒 → 汇总统计(mean/min/max/p95/rate),可选 NDJSON 转储 |
hil_debug_probe | List attached debug probes (name/type/serial), no target needed列出已连接的调试探头(名称/类型/序列号),无需目标板 |
hil_debug | Flash / erase / reset / halt / step / read / write / RTT / GDB against a debug:// target针对 debug:// 目标执行烧录 / 擦除 / 复位 / 停机 / 单步 / 读 / 写 / RTT / GDB |
hil_setup | Check or plan backend provisioning (dry-run by default; never silently installs system packages)检查或规划后端置备(默认干跑;绝不静默安装系统软件包) |
Every tool returns a JSON object with an ok flag: on failure ok:false plus an error message rather than a transport-level crash, so the model always gets parseable facts. The registry is also exposed as MCP resources at hil://devices.每个工具都返回一个带 ok 标志的 JSON 对象:失败时返回 ok:false 加一条错误消息,而不是传输层崩溃,因此模型总能拿到可解析的事实。注册表还以 MCP 资源形式暴露在 hil://devices。
Seven hundred instruments, eight curated profiles.七百台仪器,八个精选档案。
The versioned corpus spans 725 instruments from 7 vendors and roughly 294k SCPI commands. These eight profiles load by default, each with a safety policy.这套带版本的语料库覆盖 7 家厂商的 725 台仪器、约 29.4 万条 SCPI 命令。以下八个档案默认加载,每个都带有安全策略。
| Slug标识 | Instrument仪器 | Type类型 | Driver驱动 |
|---|---|---|---|
keithley-2400 | Keithley 2400 | SourceMeter (SMU)源表(SMU) | scpi |
rigol-dho1072 | Rigol DHO1072 | Oscilloscope示波器 | scpi |
keysight-ac6801b | Keysight AC6801B | AC power source交流电源 | scpi |
ea-el9000b | EA EL9000B | DC power supply直流电源 | scpi |
nordic-ppk2 | Nordic Power Profiler Kit II | Power profiler (non-SCPI)功耗分析仪(非 SCPI) | ppk2 |
alientek-atk-logic | ALIENTEK ATK-Logic | Logic analyzer (non-SCPI)逻辑分析仪(非 SCPI) | logic |
generic-cortex-m | Generic Cortex-M dev board | MCU flash/debug targetMCU 烧录/调试目标 | debug |
esp32-devkit | Espressif ESP32 DevKit | MCU flash/debug targetMCU 烧录/调试目标 | debug |
Behind them sits the wider corpus, grouped by manufacturer: Keysight 279, Rigol 211, Keithley 85, Tektronix 84, EA Elektro-Automatik 29, Rohde & Schwarz 22 and B&K Precision 15. Drop in your own profile directories to extend it.在它们背后是更庞大的语料库,按制造商分组:Keysight 279、Rigol 211、Keithley 85、Tektronix 84、EA Elektro-Automatik 29、Rohde & Schwarz 22、B&K Precision 15。放入你自己的档案目录即可扩展。
Questions, answered plainly.常见问题,直白作答。
What is HIL?HIL 是什么?
HIL (hil-harness) is a Python hardware-in-the-loop testing harness for lab instruments. It drives SCPI instruments plus non-SCPI tools (power profilers, logic analyzers, on-chip flash/debug probes) through one Python API, one CLI and one MCP server, with a safety policy on every device profile.HIL(hil-harness)是一个面向实验室仪器的 Python 硬件在环测试框架。它通过一套 Python API、一个 CLI 和一个 MCP 服务器,驱动 SCPI 仪器以及非 SCPI 工具(功耗分析仪、逻辑分析仪、片上烧录/调试探头),并为每个设备档案附带安全策略。
Does it need real hardware to run?运行它需要真实硬件吗?
No. HIL ships a simulator so procedures dry-run with hil bench run <plan>.yaml --sim before touching hardware. Real benches are addressed with tcp://, serial://, visa://, ppk2://, logic:// or debug:// URLs when you are ready.不需要。HIL 自带模拟器,因此流程可以先用 hil bench run <plan>.yaml --sim 干跑,再接触硬件。准备好后,真实工作台通过 tcp://、serial://、visa://、ppk2://、logic:// 或 debug:// URL 寻址。
Which instruments does it support?它支持哪些仪器?
The corpus covers 725 instruments from 7 vendors and roughly 294k SCPI commands. Eight hand-curated profiles load by default with safety policies, listed above, and the registry extends with your own YAML profiles.语料库覆盖 7 家厂商的 725 台仪器、约 29.4 万条 SCPI 命令。八个手工精选的档案默认加载并带有安全策略(见上表),注册表还可用你自己的 YAML 档案扩展。
How do I install it?如何安装?
HIL is not on PyPI yet. Install from GitHub with pip install git+https://github.com/adwuard/HIL.git, or paste the one-line install prompt in the hero to your coding agent and it will install, register the MCP server and run hil doctor for you.HIL 尚未上架 PyPI。用 pip install git+https://github.com/adwuard/HIL.git 从 GitHub 安装,或把首屏那一行安装提示粘贴给你的编码智能体,它会替你完成安装、注册 MCP 服务器并运行 hil doctor。
What does it cost, and what is the license?它多少钱?采用什么许可证?
Free and open source under MIT. The optional Nordic PPK2 backend wraps the GPLv2 ppk2-api library and is provisioned on demand, keeping the MIT core clean.免费且开源,采用 MIT 许可证。可选的 Nordic PPK2 后端封装了 GPLv2 的 ppk2-api 库,并按需置备,从而保持 MIT 核心的纯净。
Does it work with my coding agent?它能配合我的编码智能体使用吗?
Yes. hil mcp install registers the MCP server with Claude Code, Codex, Cursor, Qoder, Windsurf and Cline. Every tool returns JSON with an ok flag, so agents always get parseable facts instead of crashes.可以。hil mcp install 会把 MCP 服务器注册到 Claude Code、Codex、Cursor、Qoder、Windsurf 和 Cline。每个工具都返回带 ok 标志的 JSON,因此智能体总能拿到可解析的事实,而不是崩溃。
Can it debug firmware, not just measure it?它能调试固件,而不只是测量吗?
Yes. The debug driver flashes, halts, single-steps and reads RTT through probe-rs, pyOCD, OpenOCD, esptool or stlink, and every dump lands in the same spool as your captures, so a bench run and a debug session share one evidence trail.可以。调试驱动通过 probe-rs、pyOCD、OpenOCD、esptool 或 stlink 执行烧录、停机、单步并读取 RTT,每次转储都落入与捕获相同的 spool,因此工作台运行与调试会话共享同一条证据链。